eip lab
overview
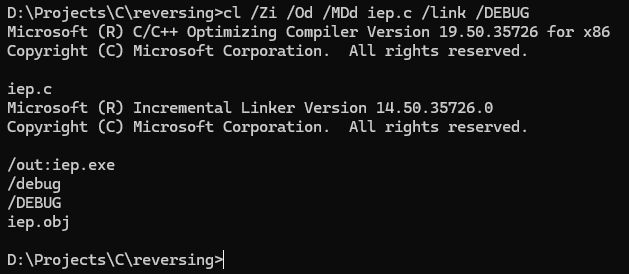
To get a better understanding of the EIP and to just get some experience debugging, I went ahead and compiled my little C program into an x86 executable with debug symbols.
stack operations
I dropped the exe into x32dbg and set a breakpoint on the main function to begin trying to redirect program flow.
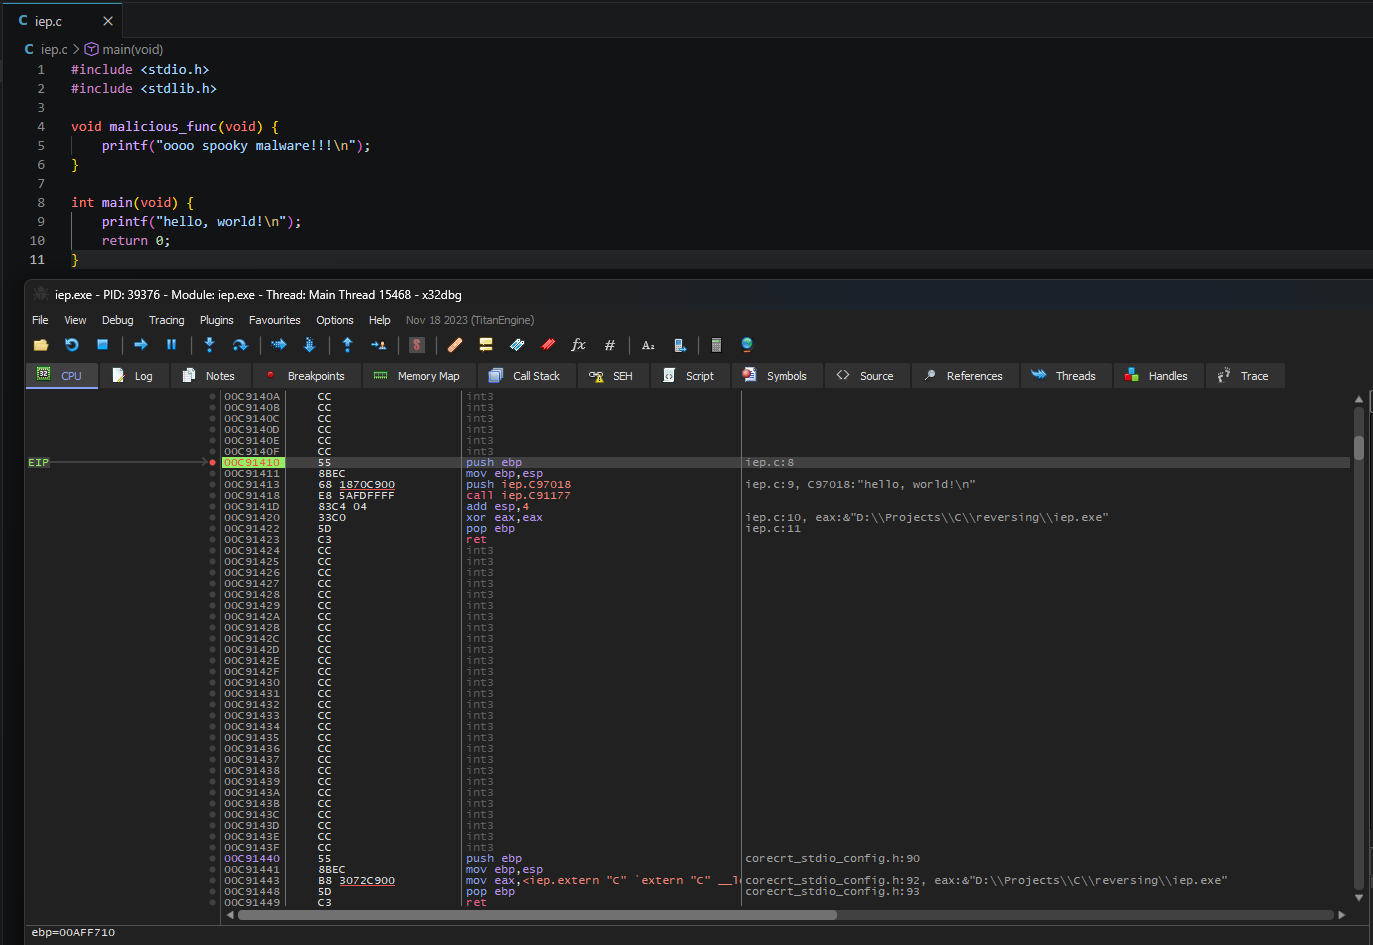
I can see that “iep.C97018” is a string containing the “hello, world!\n” message. It seems that the base pointer gets pushed onto the stack, and then the stack pointer is stored in the base pointer. After that, the pointer to our “hello world!\n” string gets pushed onto the stack. Finally, “iep.C91177” (print function) is called, and the address of the string is retrieved from the stack.
altering program flow
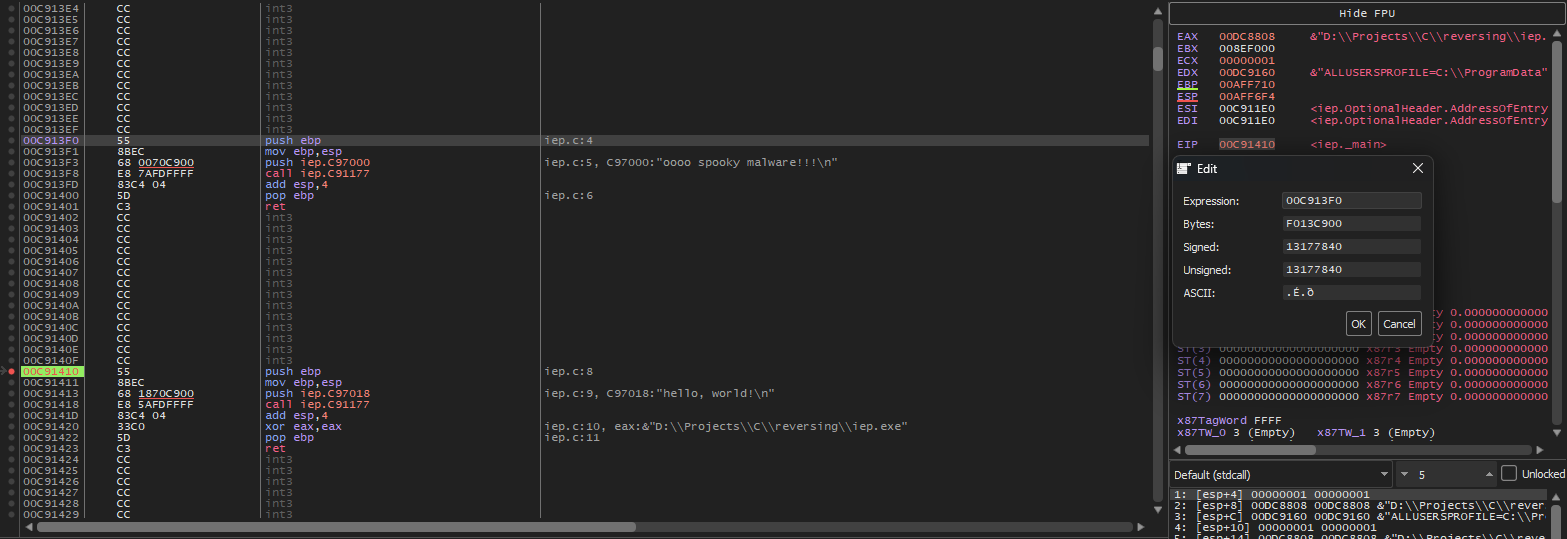
Instead of this, I’d like to point the EIP to our other function. To do this, I scrolled up a little to find the start of the malicious function. I then noted the start address and in the FPU view I edited the value of the EIP register to point to the start of the malicious function. Lets continue the program and see what happens!
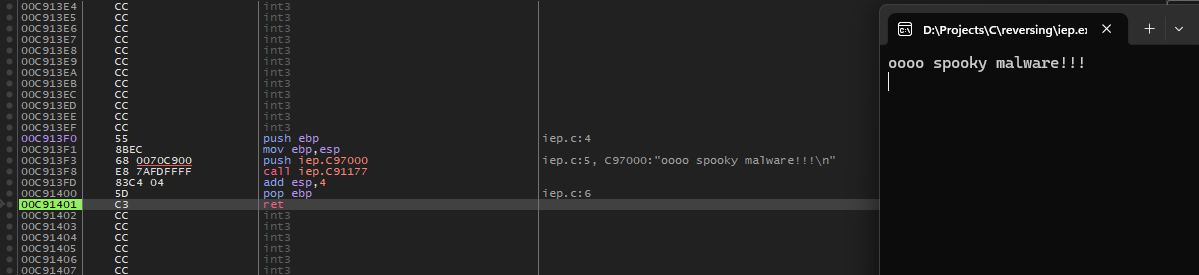
As I stepped through in my debugger the EIP continued to traverse the function and I successfully altered program flow to make a function that would never get called run!