0x2: creating an execution trace plugin for qemu tcg
overview
While researching record/replay systems for malware analysis, I came across panda.re, a platform built on top of QEMU that enables deterministic replay of virtual machines.
PANDA is currently built for QEMU version 2.9.1 (with ongoing efforts to update to later versions), while the latest QEMU version is 11.0.3 as of the time of this post being written. Along with this, PANDA is primarily designed around recording and replaying individual virtual machines.
This led me to the idea to build a full record/replay forensic suite that is integrated with Proxmox Virtual Environment, allowing for record/replay of entire virtual networks. This would ideally allow for in depth analysis of malware capable of network traversal, potentially allow for more realistic attack simulations, and would be easier to configure as it’s integrated with a virtualization platform built for management.
The project is in a very early stage, however the overall architecture looks something like this:
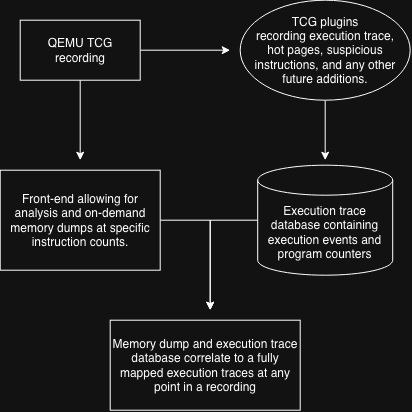
Ideally a much more extensive forensic framework would be built. For now though, I want to work on creating a TCG plugin that will create the execution trace database that I will be leveraging in the future.
record/replay
I realize that many people are likely unfamiliar with TCG or QEMU in general, so I’ll give some important background before getting into building the plugin.
QEMU, or the Quick Emulator, is a hardware emulator and virtualizer. TCG, or Tiny Code Generator, is what translates guest instructions into code operations, which is what allows QEMU to run guests across different architectures.
When a VM is running, sequences of instructions get placed into translation blocks, or TBs, this continues until a jump instruction, a system call, or the edge of a page is reached.
Because QEMU record/replay captures the non-deterministic events that influence execution, the emulator can later reproduce the same execution path.
During replay, QEMU regenerates the same translation blocks and executes them in the same order, meaning QEMU is replaying the exact instructions that were run on a VM during the time of the recording.
tcg plugins
There are quite a few existing plugins for TCG that do incredibly useful things such as logging hot pages/blocks, limiting instructions per second, tracking control flow and detecting where instructions fault, and much more.
In fact, there is a plugin called execlog.c which logs instruction execution with memory access and register changes. Although this is similar to what I’m trying to accomplish, it is designed primarily for instruction level debugging and analysis.
The goal of this part of the project is not to replace instruction logging, but to build a structured execution timeline that can be correlated with other forensic artifacts.
So with that in mind, the first task is making a plugin that will create a structured database of each execution event, its counter, and the information required to eventually correlate that event with other artifacts.
For now, I’m going to record the following information in each execution trace:
- An event ID to represent order of execution
- The virtual address of the translation block being executed
- The previous translation block that was executed
- The vCPU executing the block
- The number of guest instructions in the block
- A timestamp associated with the event
This list is by no means definitive, but for now it seems to me like a good baseline to move forward with.
implementation
QEMU’s plugin API has two very important callbacks, the first is qemu_plugin_register_vcpu_tb_trans_cb, which gets called once whenever a translation block is first translated. This callback is where I am able to grab each block’s starting virtual address (qemu_plugin_tb_vaddr) and its instruction count (qemu_plugin_tb_n_insns), and store them in a small tb_info struct.
The second callback is qemu_plugin_register_vcpu_tb_exec_cb, which gets called every single time that a block actually executes. It’s in this callback that I write all of the trace event information.
For every event, I append a single line of JSON (JSONL), allowing the trace to be processed incrementally without loading the entire file into memory. This should keep the format simple to parse while allowing larger traces to be analyzed efficiently.
{"event":36497,"time":1785883343372749687,"cpu":0,"pc":"0x4016e5","previous":"0x4017b5","instructions":7}
The goal for now is really just to create a timeline that shows which block ran at which time, after which block, and on which vCPU. Eventually I want to move this into SQLite instead of JSON, as larger traces will need to be better optimized, and it’ll make queries more efficient.
Because tb_exec executes on each vCPU thread, callbacks run concurrently if there are multiple virtual CPUs. Because of this, any writes to the trace file need to be synchronized to avoid corrupting it. I noticed QEMU’s hotblocks.c plugin uses a mutex for a similar purpose, so I adopted the same approach.
I should note that record/replay only actually utilizes one vCPU, so this wouldn’t really need to be fixed, however I wanted to ensure the plugin stands on its own independent of the larger project.
g_mutex_lock(&trace_lock);
uint64_t event_id = (uint64_t)(++sequence);
fprintf(
    trace_file,

    "{"
    "\"event\":%" PRIu64 ","
    "\"time\":%" PRIu64 ","
    "\"cpu\":%u,"
    "\"pc\":\"0x%" PRIx64 "\","
    "\"previous\":\"0x%" PRIx64 "\","
    "\"instructions\":%zu"
    "}\n",

    event_id,
    timestamp_ns(),
    cpu_index,
    tb->pc,
    prev_pc,
    tb->insns
);
g_mutex_unlock(&trace_lock);
demonstration
In order to demonstrate the plugin I wrote a small program with only one observable branch. This should emulate what a sandbox/analysis check does.
#include <stdio.h>
#include <stdlib.h>
#include <string.h>

int check_condition(int argc, char **argv) {
    return (argc > 1 && strcmp(argv[1], "evade") == 0);
}

void path_normal() {
    int total = 0;
    for (int i = 0; i < 3; i++) total += i;
    printf("normal path, total=%d\n", total);
}

void path_evasive() {
    int product = 1;
    for (int i = 1; i <= 3; i++) product *= i;
    printf("evasive path, product=%d\n", product);
}

int main(int argc, char **argv) {
    if (check_condition(argc, argv)) path_evasive();
    else path_normal();
    return 0;
}
I then ran the program twice down both paths in QEMU with my plugin, once with no arguments, and once with the evade argument.

Both traces are identical up through event 36497, same exact order and instructions, entering check_condition at 0x4016e5. The very next event is where they split.
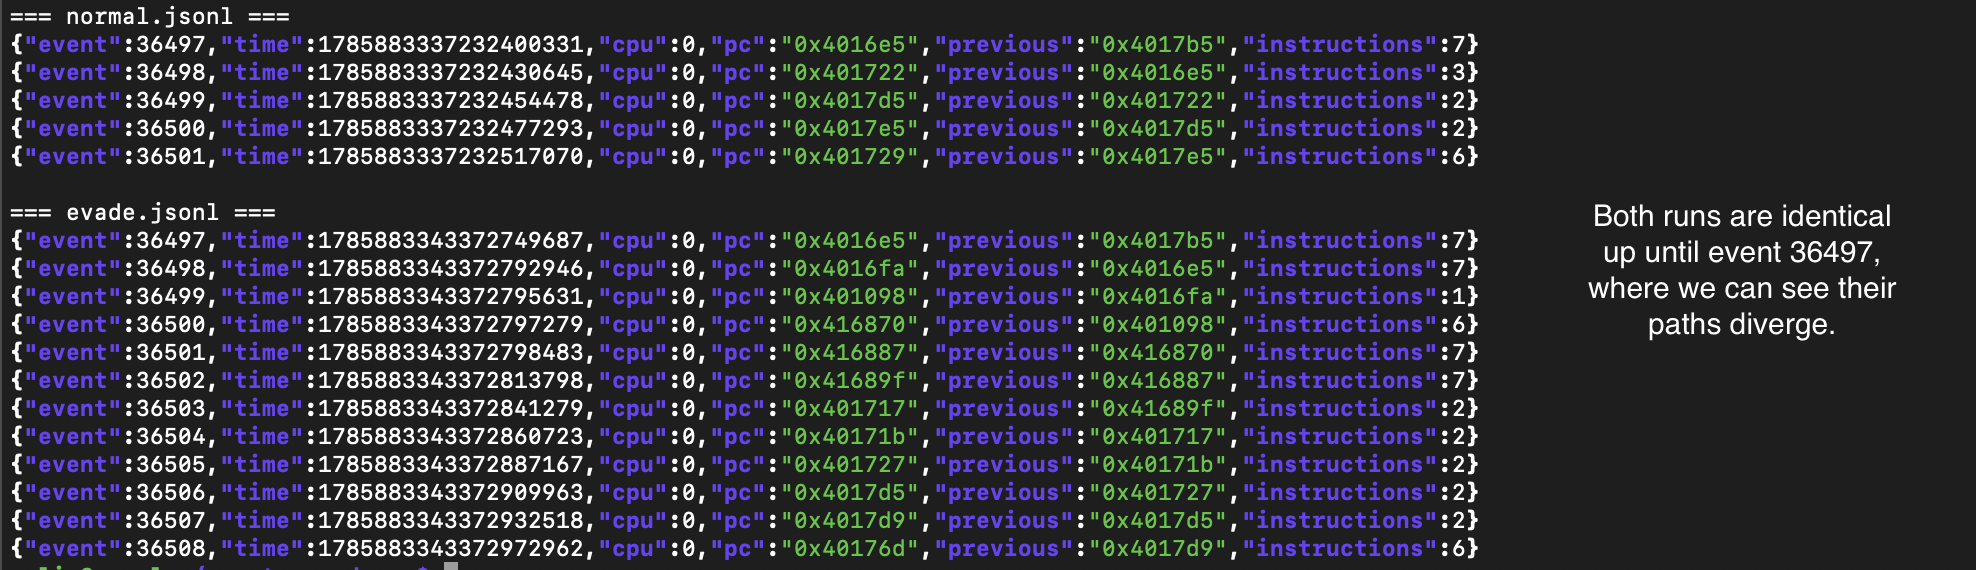
While this example is incredibly simple, I think the same concept scales to much more complex environments. Malware regularly makes runtime decisions based on environmental checks and timing, so by recording a deterministic timeline of TB execution, behavioral changes can be identified and investigated.
This will ultimately provide the foundation for higher level analysis without requiring full instruction level traces.
next steps
As it stands I have a plugin which can output an ordered timeline of block execution, acting as a foundation for the rest of the project.
Going forward I intend to flesh out the analysis side of things, figuring out how correlation is going to work, and working on the front end so it integrates nicely with Proxmox.
You can find the full source code for the plugin on my new Github
resources
- https://github.com/qemu/qemu/tree/master/contrib/plugins
- https://www.mdpi.com/2079-9292/12/14/3025/pdf?version=1688985097
- https://www.qemu.org/docs/master/devel/tcg-plugins.html
- https://github.com/qemu/qemu/blob/master/contrib/plugins/execlog.c
- https://github.com/qemu/qemu/blob/master/contrib/plugins/hotblocks.c
- https://www.qemu.org/docs/master/devel/tcg.html
- https://airbus-seclab.github.io/qemu_blog/