0x1: uncovering network artifacts in process memory
overview
It seems that in Windows forensics, historical network connection data is incredibly short lived once a socket closes, and unless additional logging like Sysmon is configured beforehand, native OS-level evidence of past connections is very sparse.
While IR environments regularly analyze live memory, traditional disk focused analysis often skips memory forensics entirely. Although memory forensics is typically the only way to obtain volatile kernel structures, remnants of connection metadata can absolutely be found in user mode memory, long after a socket has been closed.
artifact permanence
On Windows, all TCP and UDP connections on the machine are handled in kernel space. Most applications that want to initiate a connection go through the Winsock API, or more specifically the ws2_32.dll DLL. Once the connection information passes from user into kernel space, Windows networking stack creates objects representing connection states and associated processes.
These kernel objects are what the SRUM database, ETW logs, commands like netstat, and a multitude of tools use in order to function. For example, this is what Volatility’s netscan command does in order to parse kernel objects for known networking related structures.
for result in poolscanner.PoolScanner.generate_pool_scan(
    context, kernel_module_name, constraints
):
    _constraint, mem_object, _header = result
    yield mem_object
Once again, this is entirely dependent on the continued existence of connection objects. In the realm of digital forensics, this is a big issue, as on a typical Windows installation, without additional logging software such as Sysmon or firewall logging, there is often no native persistent OS-level artifact for closed connections.
connection data in user-mode memory
This does not necessarily mean that all traces of a connection are lost once kernel objects are freed. On the majority of Windows machines, network connections are going to be largely established through user-mode libraries before they are ever represented in kernel space. This means that oftentimes applications will maintain their own metadata about a connection, including the remote IP address and port.
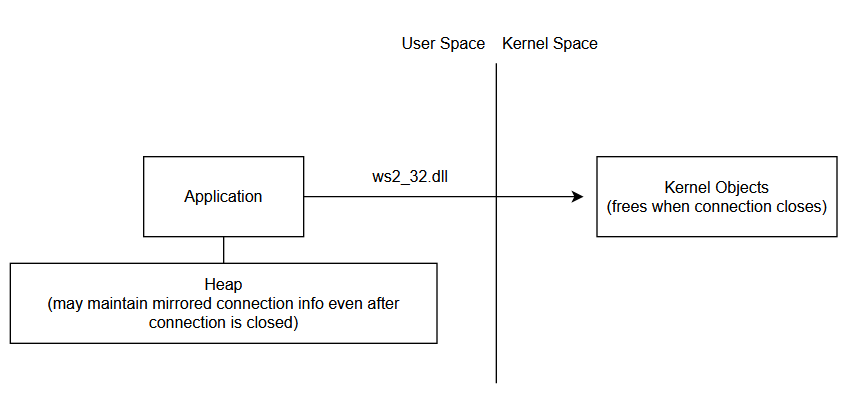
Based on the programs that I investigated for this research, it seems like these structures are usually stored in the heap or as string representations, and depending on the networking stack or how high level the program is, the connection handling becomes much more abstracted.
electron-based applications
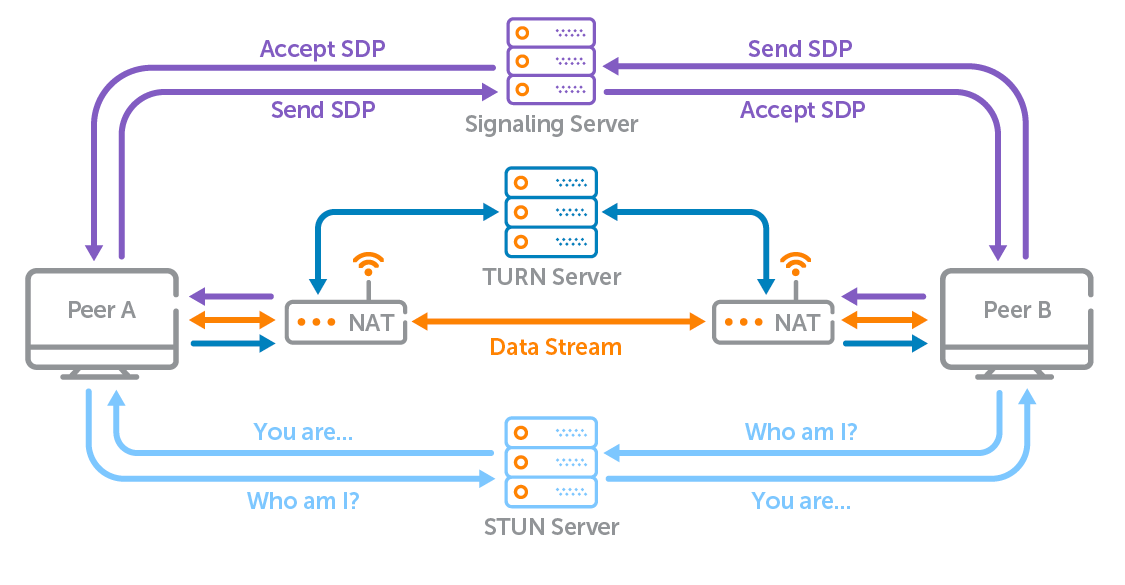
Applications built with Electron use something called WebRTC for audio, video, and data streaming over peer-to-peer connections. The way that WebRTC works is that whenever a device wants to communicate with another, a structure called an SDP, or Session Description Protocol, needs to be defined.
The SDP among other things contains audio lines, codec parameters, SSRC parameters and general metadata needed for video and audio transmission. Along with this it contains something called ICE candidates, or Interactive Connectivity Establishment candidates. ICE is the protocol used by WebRTC to handle NAT traversal and establish peer-to-peer connections. ICE candidates define the public IP address and port of both the local device, as well as the remote device.
There’s a lot more to WebRTC that I didn’t explain but if you want a good general overview of how it works, this diagram does a really good job at visualizing it.
recovering connection artifacts from signal desktop
I wanted to provide a real-world example of connection artifacts being found in process memory, and with how relevant the Signal application is in digital forensics, along with the fact that it’s built in Electron, I figured it would be a great choice.
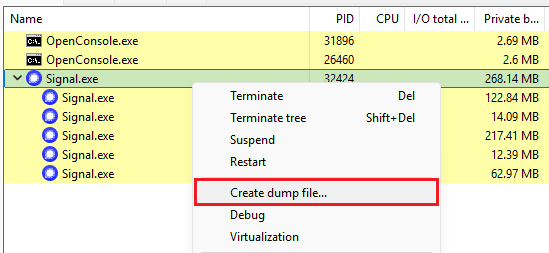
I first started a call with another Signal account and ended it after around ~15 seconds. I then continued to use my computer for a couple hours and left it on overnight. In the morning I used Process Hacker to create a dump of the process, and saved it to my desktop.
I then wrote a small script that searches for IP addresses and specifically rport strings to find any instances of an SDP structure. Using this script, I was able to identify the public IP of the call recipient sitting in memory.

import mmap, re

dump_path = sys.argv[1]

pattern = re.compile(
    rb'(\d{1,3}\.\d{1,3}\.\d{1,3}\.\d{1,3})(?:[: ]| rport )(\d{2,5})'
)

with open(dump_path, 'rb') as f, mmap.mmap(
    f.fileno(), 0, access=mmap.ACCESS_READ
) as mm:
  for m in pattern.finditer(mm):
    ip, port = m.group(1).decode('ascii'), int(m.group(2))
    o = [int(x) for x in ip.split('.')]

    if any(x > 255 for x in o) or not (1024 <= port <= 65535):
      continue

    print(f'0x{m.start():08X}: {ip}:{port}')
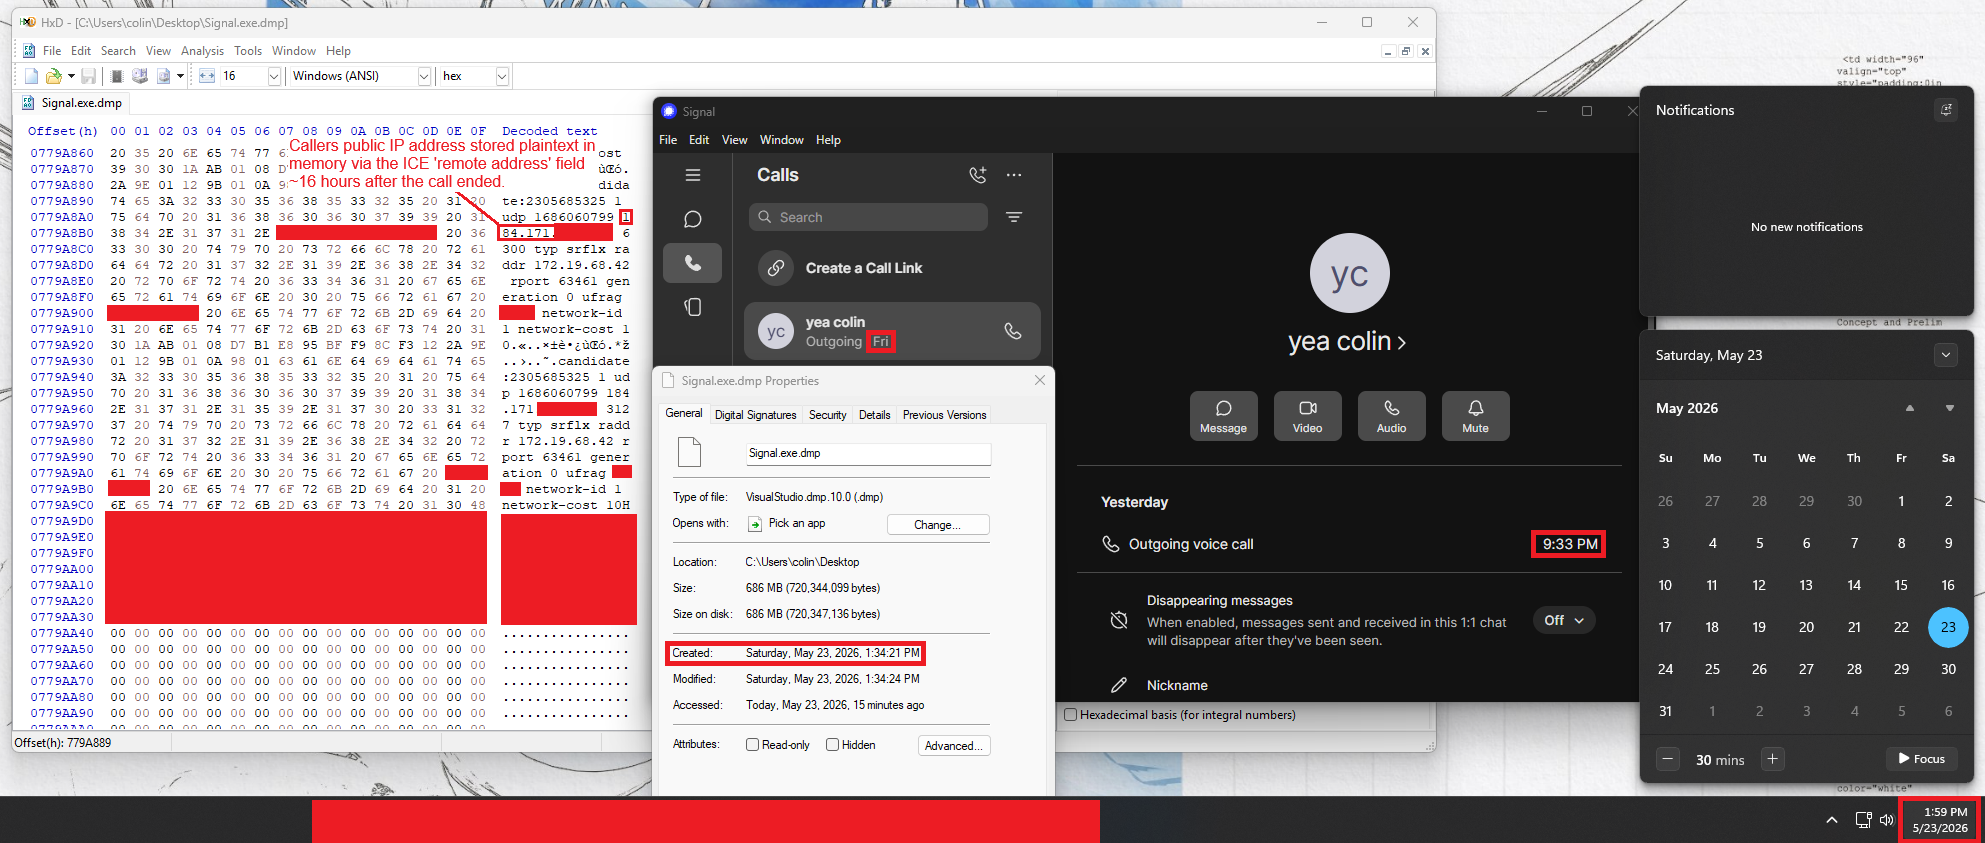
I then opened the dump in a hex editor to see the structure in memory and sure enough I was able to see the public IP address for the recepient of a call that ended ~16 hours ago.
takeaways
Traditional network forensics in Windows is heavily dependent on active connections and the persistence of kernel structures. It seems however, that many applications will store mirrored connection information in their own process memory, which can persist for hours or longer depending on garbage collection behavior, how memory retentive the program is, and where it’s allocated, as heap allocators do not automatically zero memory.
I believe that Signal Desktop as an example is fairly novel given the existence of Signals Always Relay calls, however I still believe that this is a legitimate avenue for recovering network artifacts, and tooling is within the realm of possibility.
resources
- https://webrtchacks.com/sdp-anatomy/
- https://www.wowza.com/blog/webrtc-server-what-it-is-and-why-you-need-one
- https://github.com/volatilityfoundation/volatility3/blob/develop/volatility3/framework/plugins/windows/netscan.py
- https://learn.microsoft.com/en-us/windows-hardware/drivers/network/winsock-kernel-architecture
- https://learn.microsoft.com/en-us/windows-hardware/drivers/network/winsock-kernel-objects
- https://chromium.googlesource.com/external/webrtc/%2B/lkgr/api/candidate.h